Broadband “speed testing” emerged as one of the primary metrics for measuring cloud based throughput, especially an entire segment of routed customer’s traffic. Common tools for network performance measurement, such as Speedtest and Iperf, can provide inaccurate results when using the Zscaler service. This is due to their test conditions and the methods they use to test network throughput. Hence, they are not accurate indicators of “speed” while testing cloud based security offerings. To obtain a more accurate measure of end-user performance Zscaler recommends that you use one of your browser's network analy the Zscaler Analyzer tool which was designed to emulate end to end user experience with Zscaler, sis tools, or Wireshark.
Issues with Common Measurement Tools
One issue with some measurement tools is the length of the test. For example, the length used for Speedtest is only 10 seconds. This has an impact as many internet service providers boost the available bandwidth for a short period of time or for a portion of a transaction. Since the type of file that can be uploaded or downloaded over 10 seconds usually falls within this boosting window, this can provide results that are much higher than the true average speed.
The Zscaler service uses data trickling to help avoid timeouts and this can also impact the results. With data trickling, Zscaler sends a small amount of data to the browser to keep the session open while the rest of the data is buffered for scanning. As soon as the Zscaler service has determined that the connection is allowed, the rest of the data in the buffer is released to the client. This can cause problems as Speedtest does not include the fastest 10% or the slowest 30% of data in their analysis. As a result of this, the buffer release will likely be treated as an outlier and not included in the results. Because of this, the majority of the test is based on the trickle function which is not indicative of the true speed.
Another aspect of testing that can lead to misleading results is caching. While Speedtest has taken steps to address this concern many services have not. Many types of services and software cache content that is known to be safe. If this content hasn't changed recently, it's delivered directly from the cache to the user. If this type of data is included, it gives results with much higher speeds than could be achieved without caching.
Iperf shares many of the same issues Speedtest has. In addition, it's highly susceptible to both server limitation and limitation on a single session.
A Better, Simpler Test
The best way to test your connection is over a longer period of time then 10 seconds and with a much larger file. Zscaler currently recommends to find a file that takes on the order of minutes (vs. seconds) to download. Once located, download this file once directly connected to the Internet and once through your cloud security service. Compare the download times.
You can consider the following recommended tools in the next section.
Recommended Tools
Azure Storage Blob Download Speed Test
Test downloading of a 100MB file from any data center - Azure Storage Blob Download Speed Test - Azure Speed Test
Zscaler Analyzer
Zscaler Analyzer provides a good measure of your end user's experience when using the Zscaler service. This tool can determine how long it takes for your browser to load a webpage and can plot the path between your location and a ZIA Public Service Edge. To download Z Analyzer go to https://zmtr.zscaler.com and for installation instructions, see How do I use Zscaler Analyzer?
Cloud Performance Test
The Zscaler Cloud Performance Test tool collects performance troubleshooting information for end users when connecting to the internet through the Zscaler Internet Access (ZIA) cloud service. This tool runs several performance tests, such as download or upload bandwidth, between the browser and the ZIA Public Service Edge or ZIA Private Service Edge to which the traffic is forwarded. Open your browser and enter http://speedtest.zscaler.com in the address bar. You are automatically redirected to your ZIA Public Service Edge or ZIA Private Service Edge instance, which acts as the server for the speed test tool. To learn more, see Using the Zscaler Cloud Performance Test Tool.
Cloud Performance Monitor Test
Cloud Performance Monitor Test helps you to observe the performance of Zscaler ZIA Public Service Edge. The latency shown in the test is the round trip time of a HTTP request from your machine to ZIA Public Service Edge. To use the Cloud Performance Monitor Test, go to https://ip.zscaler.com/ > "Connection Quality" > "Start Test"


Browser Developer Tools
Many web browsers also provide powerful network analysis tools that can help analyse your end user's experience.
To use developer tools, see the relevant product documentation:
Wireshark
Wireshark is another highly useful tool for troubleshooting network performance issues. With an I/O graph, you can compare the performance of traffic that goes through Zscaler and traffic that goes directly to the internet. It also helps you to identify if you are hitting a bandwidth cap or if the throughput plateaus. To learn more, see Wireshark's documentation on I/O graphs.
The Wireshark summary page also provides a good overview of download speed.
WinMTR
WinMTR is a free MS Windows visual application that combines the functionality of the traceroute and ping in a single network diagnostic tool - WinMTR download | SourceForge.net
Analysing MTR Results
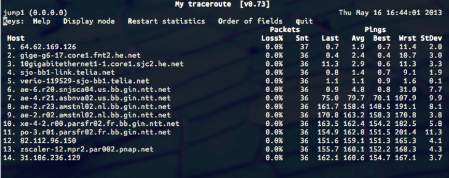
When analysing your traffic it is also important to be aware of how to interpret MTR results as packet loss doesn't necessarily indicate a connectivity problem. Consider the following example.

Here you can see that there is a gradual increase in latency as the traffic travels from source to destination. Yet, there is little to no packet loss. This is an example where there is not a connectivity problem.
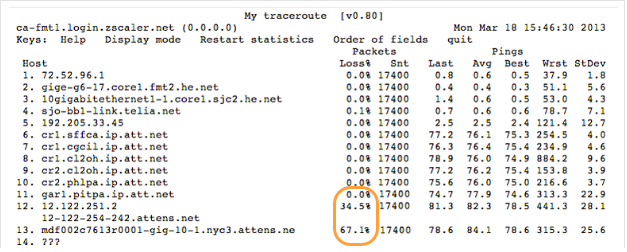
In contrast, consider the following traceroute:

In the last few hops, there is a noticeable spike in latency. Since the loss begins at the end of the trace and the end of the trace is the customer's gateway, this indicates that the problem is with the customer's ISP.
Potential Causes of Network Performance Issues
If after measuring your traffic you still feel you are having network performance issues, there are multiple reasons that are not caused by the Zscaler service. One such reason is DNS traffic. DNS plays an important part in network performance. Although it primarily impacts traffic when using transparent traffic forwarding. It can also impact explicit traffic forwarding when you are using PAC files.
When using transparent traffic forwarding methods the browser is not aware of a proxy being present in the transaction. Consequently, all websites that users access need to be resolved by the computer itself. This increases dependency on DNS.
While using PAC files, the pac.<cloudname>.net needs to be resolved, which requires DNS. In addition, if logic such as dnsResolve(host) or isInNet(host, "y.y.y.y", "x.x.x.x") is used, then every new domain that is accessed needs to be resolved. This also increases dependency on DNS.
When there is a high dependency on DNS, a delayed response from the DNS server negatively affects page loading times. One common reason for a delayed response is web pages that fetch content from multiple websites, not a single destination.
Performing NAT on your gateway device before forwarding traffic to the ZIA Public Service Edge can also impact performance. The device performing the NAT overload could potentially run out of source ports. This can result in performance issues, pages not loading, and broken applications.

